
|
State Schools Chief Jack O’Connell Releases School District Budget Cuts Survey Results
By Anonymous — Thursday, June 10th, 2010
Schools Make Deep Cuts to Programs Due to Budget Crisis
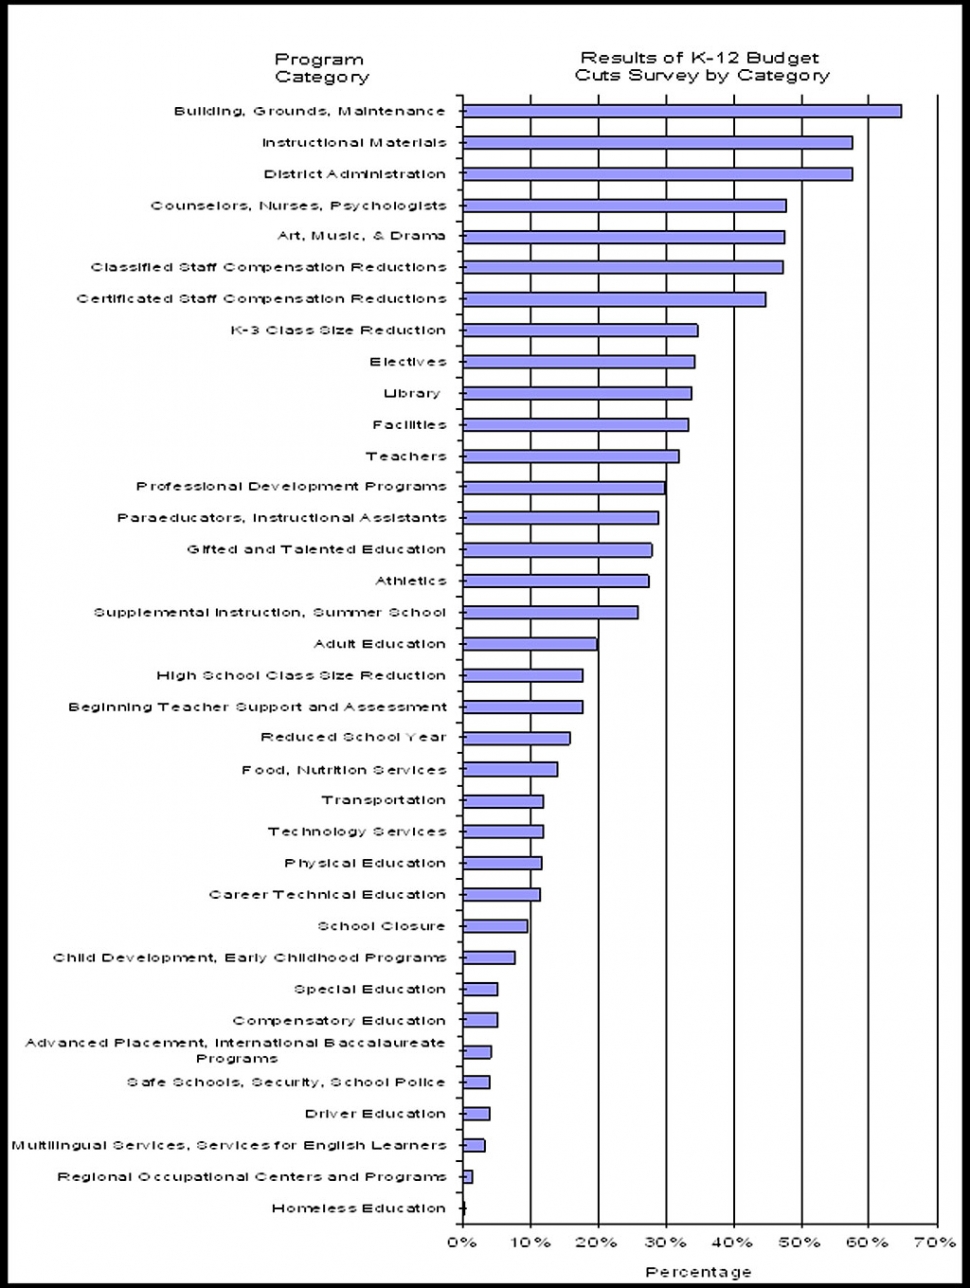 SACRAMENTO – State Superintendent of Public Instruction Jack O’Connell today released the results of a survey of local educational agencies (LEAs) to find out how state budget cuts to public education are affecting them. O’Connell held a news conference in the Natomas Unified School District in Sacramento County where all eight elementary school libraries were shut down to close a budget gap. The survey results are attached. “The survey results make clear that school administrators are making heartrending decisions to balance their dwindling budgets while trying valiantly to keep students’ best interests in mind,” said O’Connell. “Sixty-five percent of districts that responded to this survey made cuts to building and school grounds maintenance, 58 percent cut funding for instructional materials, and 58 percent reduced funding for district administration. Forty percent of respondents have reduced the number of teachers; reduced or eliminated summer school; increased class sizes; and cut art and music classes, closed libraries, eliminated school nurse positions, and canceled sports programs. “These deep cuts to our schools were made even though the American Recovery and Reinvestment Act provided critical funds to save education jobs last year. These funds are now running out, and our state budget picture continues to look bleak. In the Governor’s May Revise, he proposes another $1.5 billion in general-purpose funding cuts that will exacerbate the current annihilation of services to students. “Our public education system is in crisis. These cuts hurt students and hurt California’s future economic viability. I call on the Governor and the Legislature to show the courage and leadership needed to find a budget solution that puts students first and protects our schools from further cuts.” The California Department of Education launched the survey in April to ask administrators in county offices of education, school districts, and charter schools how they have balanced their budgets in light of state budget cuts to public education. At the close of the survey in May, 387 LEAs responded. They represent 1.7 million students, or 26 percent of the statewide enrollment. The cuts at Natomas Unified School District are similar to cuts made by LEAs throughout the state. “We made the decision to close our eight elementary school libraries with a heavy heart, but our budget situation is so dire that we had no choice,” said Natomas Unified School District Superintendent General Davie, Jr. “We’ve also cut all of our health aides, eliminated busing, shortened our school year by five days, increased K-3 class sizes to 30-1, and issued layoff notices to about 30 percent of our teachers, classified staff, and administration.” Administrators were asked questions on what type of educational organization they are; which programs were cut or eliminated in the last two school years, 2008-09 and 2009-10; enrollment data as of October 2009; and what other actions were taken in the last two school years such as staff reductions, school closures, or reduced school year as result of funding cuts. These are the results of K-12 budget cuts survey by category and the percentage of respondents that made cuts in those categories. Results of K-12 Budget Cuts Survey by Category Building, Grounds/Maintenance District Administration Instructional Materials Counselors, Nurses, Psychologists Art, Music, & Drama Classified Staff Compensation Reductions Certificated Staff Compensation Reductions K-3 Class Size Reduction Electives Library Facilities Teachers Professional Development Programs Paraeducators, Instructional Assistants Gifted and Talented Education Athletics Supplemental Instruction, Summer School Adult Education High School Class Size Reduction Beginning Teacher Support and Assessment Reduced School Year Food, Nutrition Services Technology Services Transportation Physical Education Career Technical Education School Closure Child Development, Early Childhood Programs Compensatory Education Special Education Advanced Placement, International Baccalaureate Programs Driver Education Safe Schools, Security, School Police Multilingual Services, Services for English Learners Regional Occupational Centers and Programs Homeless Education For more information on the state budget crisis impact on education, please visit the California Department of Education’s Budget Crisis Report Card Web page at http://www.cde.ca.gov/nr/re/ht/bcrc.asp. |