
|
2011 Academic Performance Index Base, Growthtargets, And School Rankings
 By Anonymous — Monday, June 18th, 2012
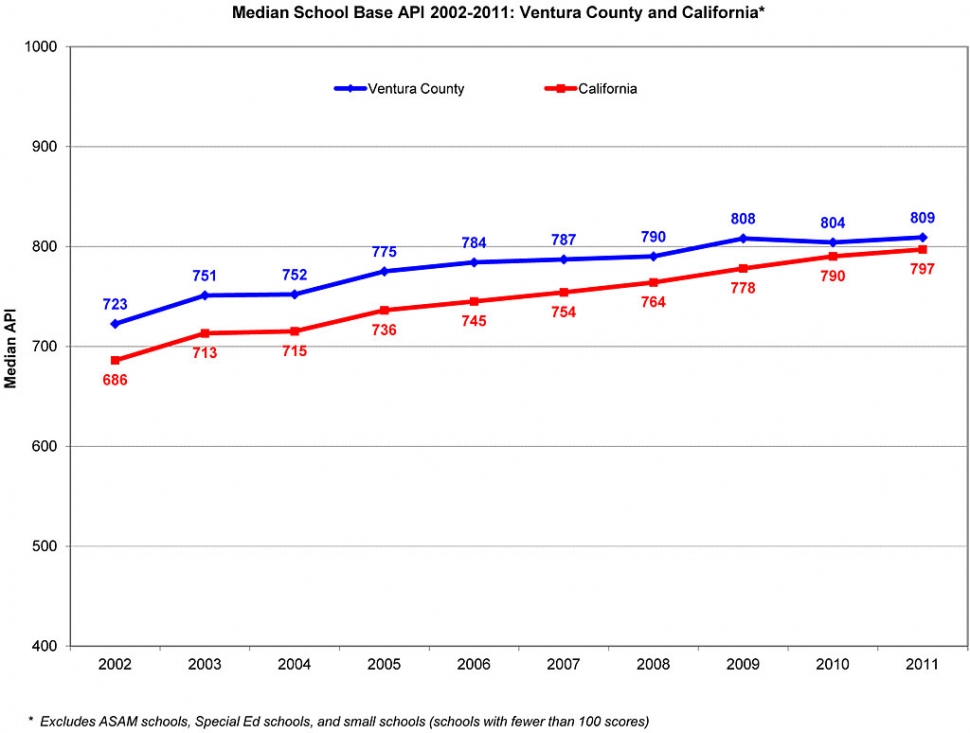
 Ventura County Office of Education  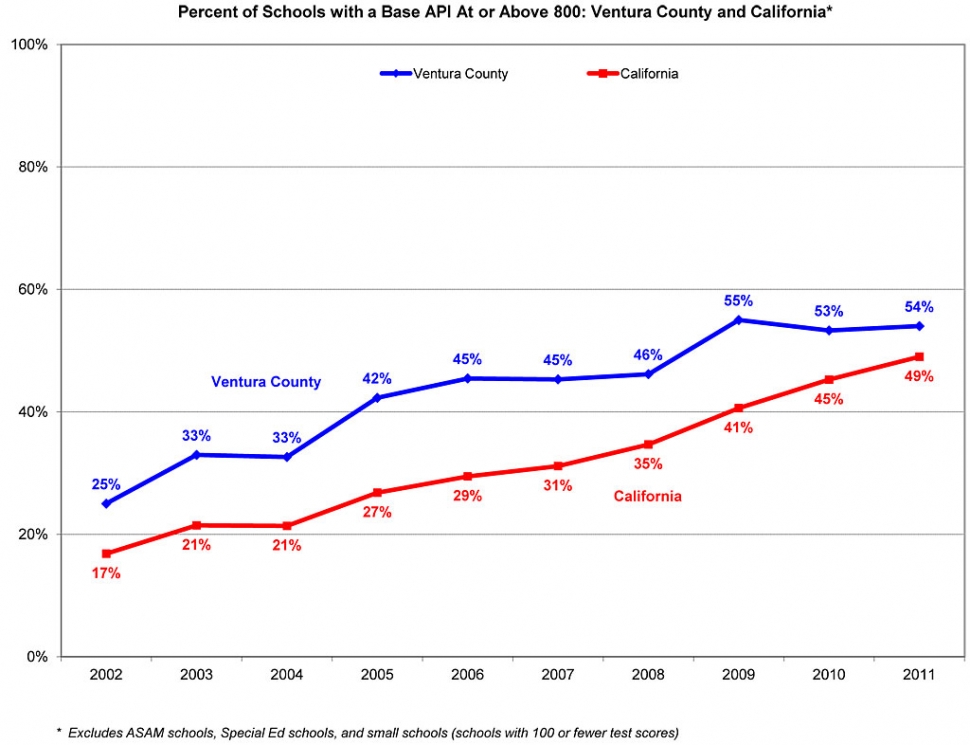 Today, the California Department of Education released the 2011 Academic Performance Index (API) Base Reports. The reports include the Base APIs, Growth Targets, and Statewide and Similar Schools rankings for nearly every public school and district as mandated by California’s Public Schools Accountability Act. The 2011 Base Reports reflect results of 2011 statewide testing. Of the 184 Ventura County API recipient schools that are not ASAM (Alternative Schools Accountability Model) and have student populations of 100 or more students, 99 schools (54%) posted APIs of 800 or better, up slightly from 53% last year. Oak Hills Elementary School in the Oak Park Unified School District attained the highest Base API in Ventura County, 952 on the 1000-point scale. For the fourth year in a row the highest Base API for a middle school in 2011was earned by Medea Creek Middle School, also in the Oak Park Unified School District. The Medea Creek API in 2011 was 929. Finally, the highest Base API for a high school was 914, earned by Foothill Technology High School, in the Ventura Unified School District. To continue to look at outstanding performers we must search out those schools that score well in an absolute sense (statewide rank) and in relation to schools with similar student populations (similar schools rank). This year one Ventura County school received both a Statewide Rank of 10 and a Similar Schools Rank of 10: • Santa Susana High School (Simi Valley Unified) Seventeen schools in Ventura County (9%) scored in the top ten percent of California schools. Districts represented include: Conejo Valley Unified, Oak Park Unified, Pleasant Valley Elementary, Simi Valley Unified, and Ventura Unified. Twenty-three schools in Ventura County scored in decile 9, meaning that 22% of schools in Ventura County are currently ranked in the top 20% of the State. One hundred schools (55%) ranked above average (deciles 6-10), one more than last year. Often school success is in large part a product of district-wide efforts. This can be seen in a number of local schools that, while facing some of the region’s most formidable educational challenges, have made more academic progress than similarly challenged schools. Five schools scored in the top ten percent (rank of 10) of their California peers on this similar school ranking. Santa Paula Elementary School District • Barbara Webster Elementary School • Grace Thille Elementary School Simi Valley Unified School District Santa Susana Elementary School Sycamore Elementary School Santa Susana High School Nine school districts posted district-wide API scores at or above the State target of 800. Districts included Oak Park Unified (918), Santa Clara Elementary (896), Conejo Valley Unified (875), Mesa Union (869), Pleasant Valley Elementary (865), Moorpark Unified (837), Simi Valley Unified (828), Ojai Unified (802) and Ventura Unified (801). Mr. Mantooth stressed that, “I am confident that the staff, students, and parents of our Ventura County schools will continue their efforts to help all students succeed. Even in these very challenging economic times they are working to narrow the achievement gaps between traditionally higher and lower-scoring student subgroups. The focus has not wavered from having every student college and career ready. Their efforts have the full support of local school districts and boards of education. It takes everyone involved in our student’s education to keep our schools on the path toward academic excellence.” BACKGROUND INFORMATION The 2011 API Base also reflects new regulations which revised the definition of “continuously enrolled” and require student accountability results from an alternative education program to be assigned to the school and school district of residence under specific circumstances. The State Board of Education has set 800 as the target API that schools and districts should strive to attain. Additionally, each school is rated on two 10-point scales, one reflecting the school’s overall level of achievement (for example, a 10 would indicate the school is in the top 10% of all California schools), and the other representing how well the school has performed as compared to schools with similar student populations elsewhere in the state. Schools with numerically significant groups of students within schools also have annual APIs and annual growth targets. Over the years the API subgroup targets have become more challenging. Schools must make a minimum of 5% growth between its 2006 subgroup APIs and 800 until the API score approaches the state target of 800. |