
|
School Administrators React to API Scores
 FUSD Administrators hope scores are recovering from last year’s dip. By Mariandrea Mueller — Wednesday, July 1st, 2009
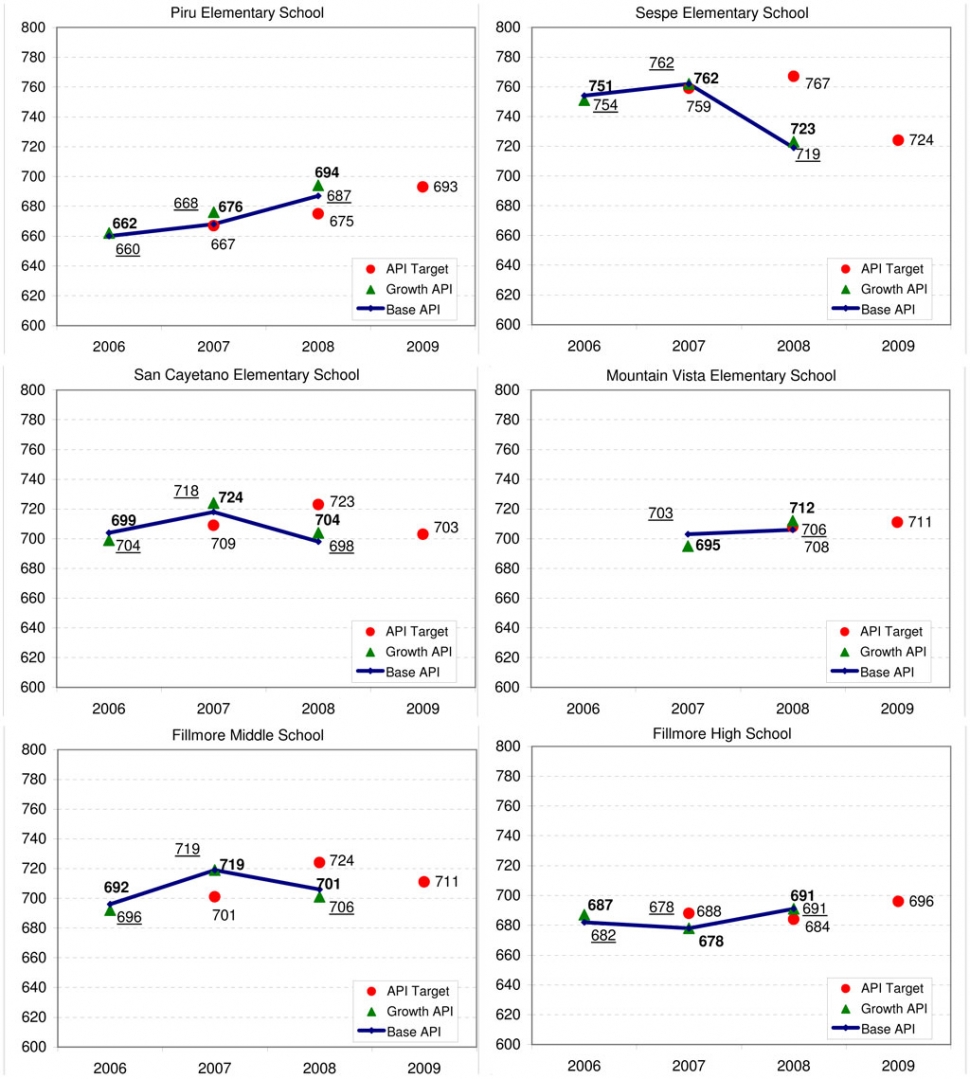 Each year in the above charts refers to the test year. For example, standardized tests were taken in Spring 2008 (near the end of the 2007-2008 school year). Growth API scores (in bold) based on those tests were released in August 2008. The scores were adjusted by the California Dept. of Ed. to compensate for changes in the tests themselves and decisions made by the State Board of Ed, so that schools can be ranked. The adjusted scores are the Base API scores (underlined), and 2008’s Base API scores were released in May 2009. In May of 2007, the API Target for 2008 was set. API Scores range from 200 to 1000, and are based on a formula that weighs various standardized tests. The state goal is 800. The Public Schools Accountability Act urges each school to improve its performance each year by 5% of the difference between their Base API and 800, with a minimum target of increasing five points. In late May 2009, California Department of Education (CDE) released Base Academic Performance Index (API) scores developed primarily from scores on standardized tests taken in Spring 2008. Fillmore Unified School District (FUSD) had received Growth API scores based on the same testing period in August 2008, and at a September School Board Meeting each principal presented his or her school’s Growth API score along with the school’s plans for improvement. The results from the Spring 2009 tests will not be available until August, so no one yet knows whether the interventions worked, but administrators hope that the Sespe and San Cayetano are recovering from last year’s dip in scores. (See chart.) The API is a measurement developed by the California Department of Education to be the cornerstone of the Public Schools Accountability Act (PSAA), which created an educational accountability system for California public schools. The PSAA’s primary goal is to help schools improve and to measure the academic achievement of all students. The API score is based on different standardized tests results depending upon which grade-levels the school has, and which factors the State Board of Education (SBE) has decided to include. According to the Education Data Partnership (EDP), the PSAA indicated that "Criteria other than test scores—such as school staff attendance and graduation rates—were supposed to be added. So far the state has only used test score results." The tests vary enough from year to year, that the formula for calculating Base API must be adjusted to compensate for changes in the tests and in what factors are included. For this reason, a Growth API is released in August, but the Base API, which allows schools to compare their scores to previous years’ scores and other schools’ scores, is not released until May. This is a significant lag time for school districts to operate under when trying to adjust programs to improve scores. School API rankings are also released in May. There are two sets of rankings for each school: its rank among all California schools of the same type or grade-level (i.e., elementary, middle, and high schools), and its “Similar Schools” rank. EDP explains, “For each type of school, 10% of the schools are placed in each decile group; the groups are numbered from 1 (the lowest) to 10 (the highest). “Similar Schools” have comparable student demographics. Factors include ethnicity, mobility, free/reduced price meals, parent education level, percent of English learners, percent of re-classified fluent-English-proficient students, percent of migrant education students, percent of students in gifted and talented programs, percent with disabilities, class size, and grade span enrollments. Each school is considered similar to 100 other schools, and those hundred are divided into decile groups with a 1 to 10 ranking assigned to each group. There is an evident contrast between FUSD’s elementary schools. Piru’s Similar Schools Rank climbed steadily from 4 to 6 over the past three years. Mountian Vista’s Similar Schools Rank went from 5 to 3 over the past two years. San Cayetano’s Similar Schools Rank held at 4 based on 2006 and 2007 scores, but dropped to 2 in the latest rankings. Sespe’s Similar Schools Rank held at 7 based on 2006 and 2007 scores, but dropped to 2 in the latest rankings. Sespe and San Cayetano scored well below the target Base API score. As of September, Sespe’s intervention plan included weekly teacher collaboration for all grades, not just 4th and 5th, and focused data analysis approximately every four weeks. Sespe’s report stated, “All teachers will be trained in the ADEPT in order to test their English Learners in order to have current information about their students’ English proficiency.” Sespe also considered a behavior modification plan, Lesson One, which had been successful in Piru. Geri Lunde, Principal of Sespe, recently confirmed that all teachers had the opportunity to learn ADEPT testing. Unfortunately, the school had no funds available to purchase Lesson One, but focused on character development on an ongoing basis with weekly bulletins highlighting specific character traits. Lunde noted that the teachers’ weekly collaboration sessions included intervention planning, enabling the teachers to develop a variety of responses to individual students’ needs. She hopes that this year’s numbers, to be released in August, have gone up. San Cayetano’s intervention plan also included teacher collaboration. According to the September report, teachers were “pulling individual student scores and plan to meet monthly to revise and adjust student intervention needs.” Principal Jan Marholin recently explained that over the past year school leaders had implemented Response to Intervention/Instruction (RTI) and weekly teacher collaboration. Resource Teacher Steve Miech and Speech Pathologist Inger Overton have focused on improving students’ reading and language arts skills. All teachers took turns participating in monthly visits to other classrooms to observe English Language Development, gauge student engagement, gather new ideas, and see what and how the other grades are teaching. Overton explained that teachers had been made aware of each student’s reading level (e.g., at mid-level for that grade, at beginning grade-level, at end grade-level), and that students had been temporarily divided if necessary to receive language arts instruction tailored to their level to give them the greatest opportunity to advance. Teachers reassessed students at the end of each grading period before the report cards went out. This allowed them to react to successes, react to trouble spots, and fix any holes in the program. Overton noted that it might take a few years to see scores go up, but that all first grade kids could read by the end of the year. Marholin said that next year would include an increased focus on math. Piru Elementary School’s Growth API had gone up. In September, Piru credited its success to: having Literacy Coach who consults on instructional strategies based on school-wide goals; aerobic exercise; and Lesson One, a program which encourages students to take responsibility. Principal Richard Durborow explained that studies have shown aerobics prepares the brain for more and longer cognitive activity, and boosts memory. He said that teachers can spend more time instructing and less time disciplining students when students have learned self-control and exhibit a better attitude. Durborow pointed out that Piru’s API scores had been dropping before he started as principal three years ago. Durborow praised Piru’s partnership with the Ventura County Office of Education (VCOE) which conducted an instructional curriculum audit in February 2007. Durborow was sorry that VCOE’s suggestions to Piru were not implemented at other FUSD elementary schools as well. VCOE made classroom observations and provided information about time on task, instructional methods, Marzano strategies, Bloom’s theories, organizing subject matter in ways that increase learning, and self-assessment. Piru used research-based strategies to put professional programs in place to improve student learning. VCOE’s input was used to set organizational goals. Mountain Vista also showed improvement. At that time, Mountain Vista’s administrators attributed their success to collaboration and RTI. Programs that helped were: REACH, Horizons, and Waterford/Success Maker. Their intervention plan included improving teacher collaboration and tying grades to actual progress. This year, Principal Chrissy Schieferle said Mountain Vista used collaboration time to determine which of California’s Content Standards were essential, that is, most tested and most needed by students in future grade-levels. Next year, each grade will have one hour per day of targeted instruction. Classroom teachers with additional support staff will provide differentiated instruction for all students: struggling, gifted, or in-between. |