
|
How high is the water?
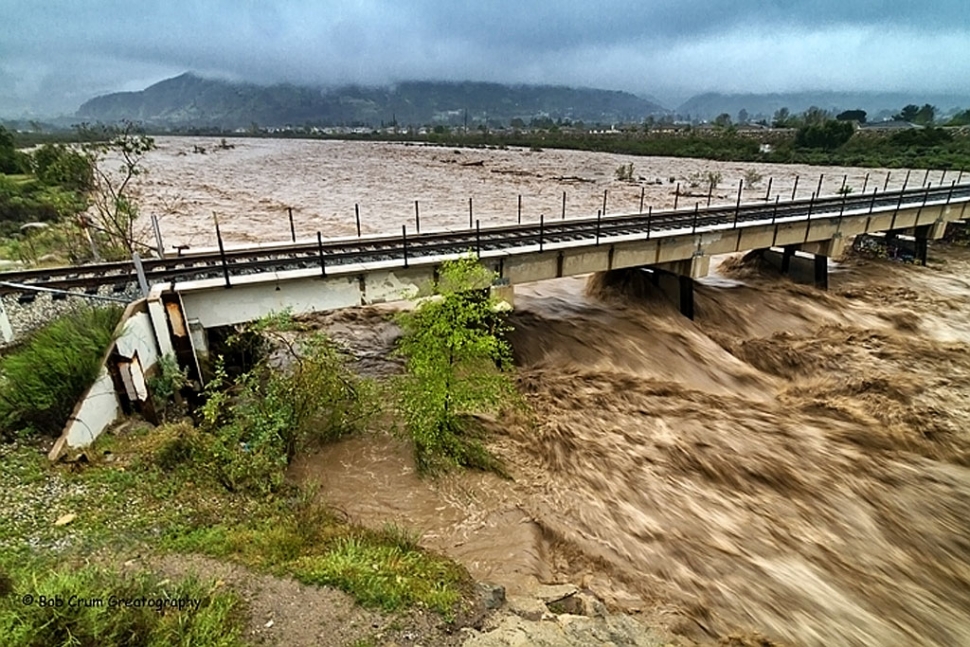 Sespe Creek overflow looking north. By Bob Crum — Monday, March 21st, 2011
Story and photos by Bob Crum
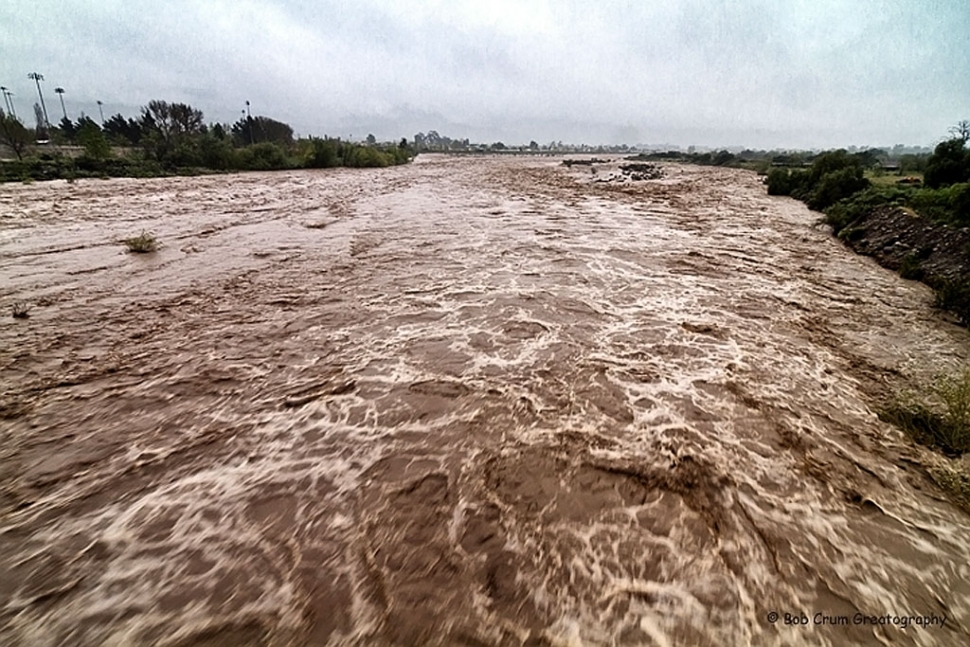 Sespe Creek looking south. 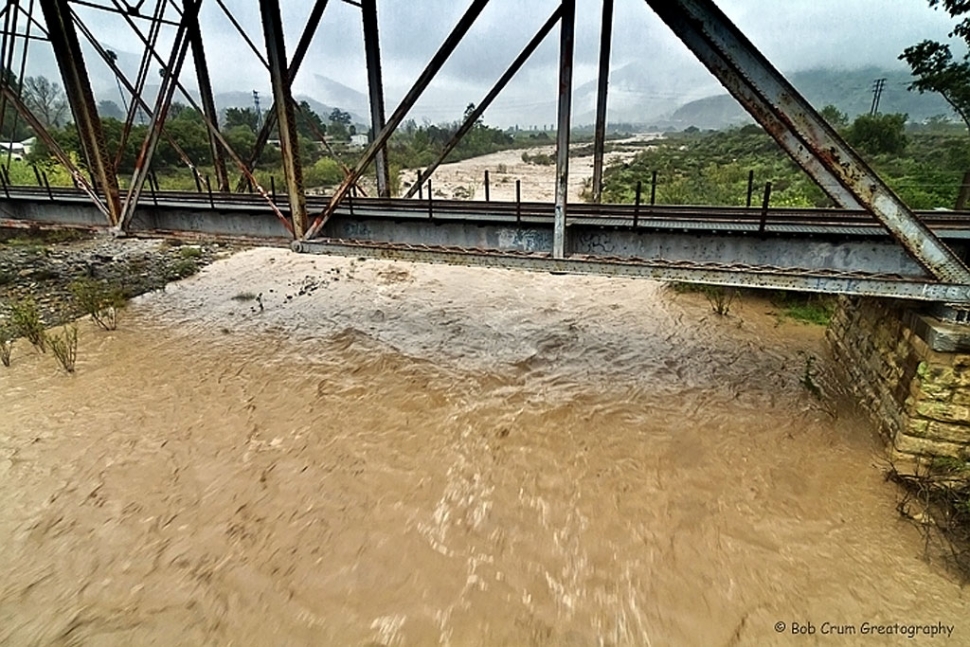 Main Sespe Creek looking north. 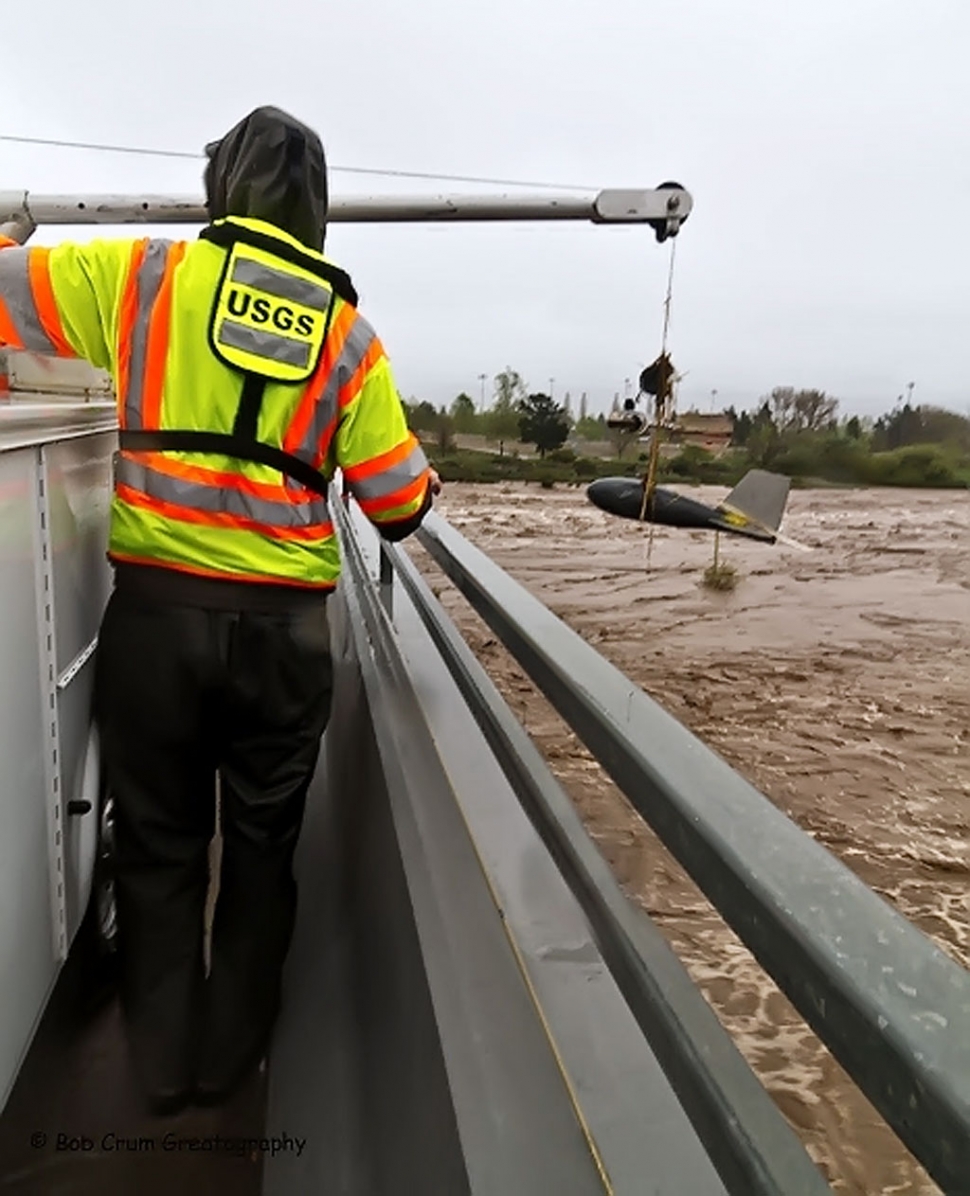 Preparing to lower the measuring device of Old Telegraph Road bridge into Sespe Creek. 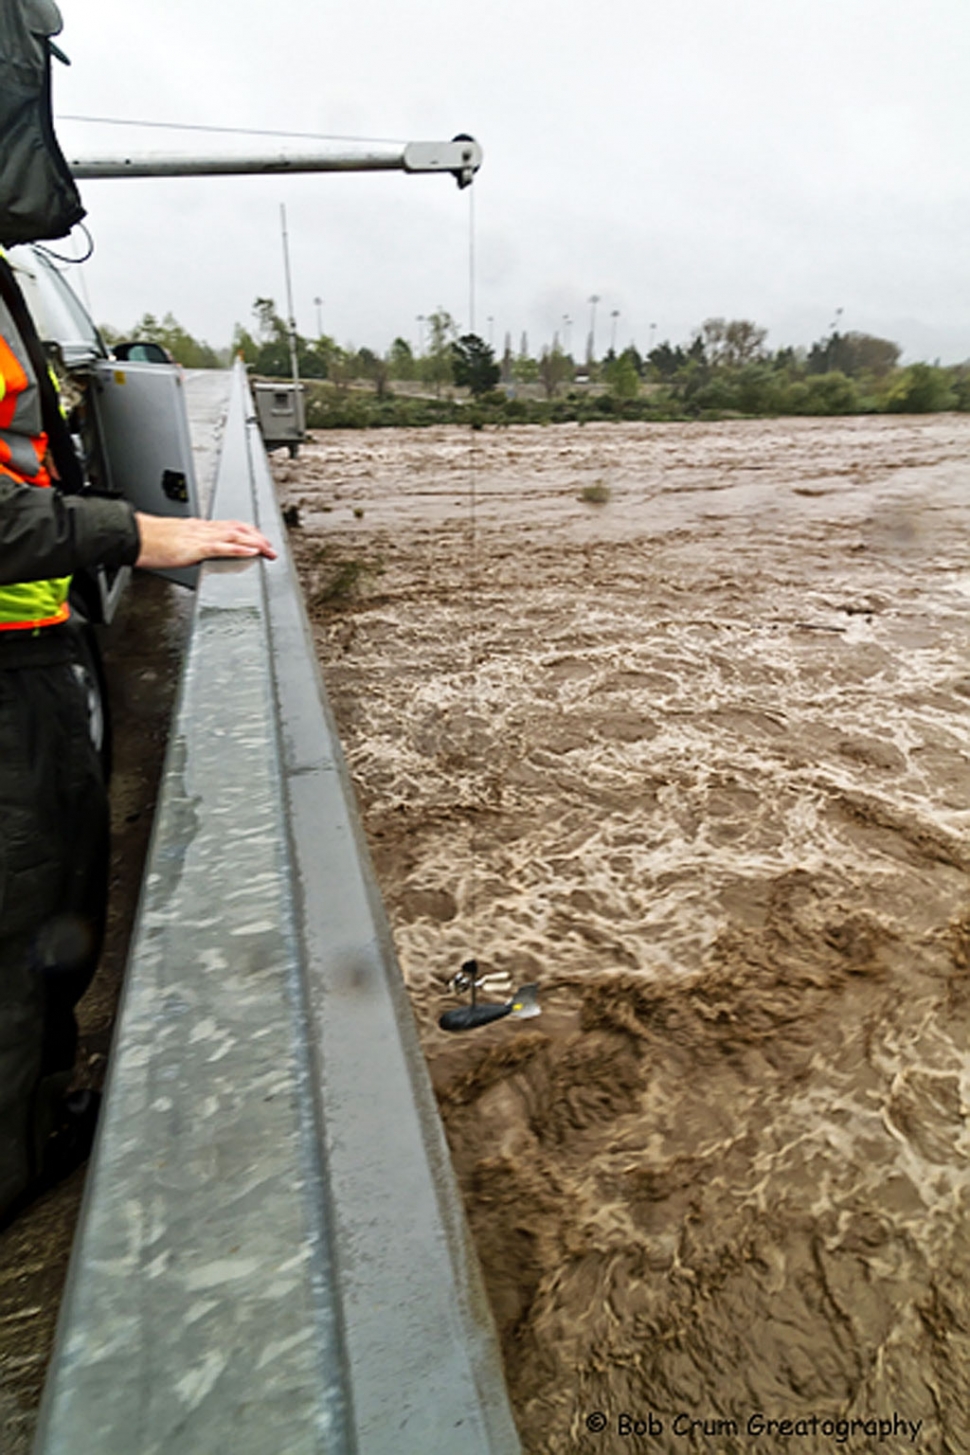 The measuring device about to enter the water below. 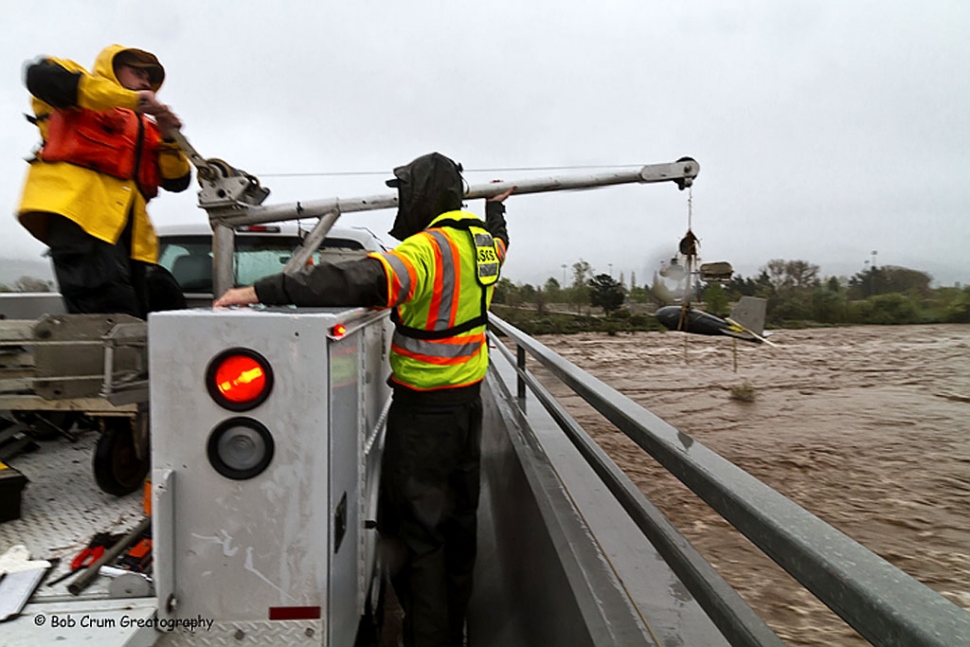 Bringing up the measuring device to check the reading. 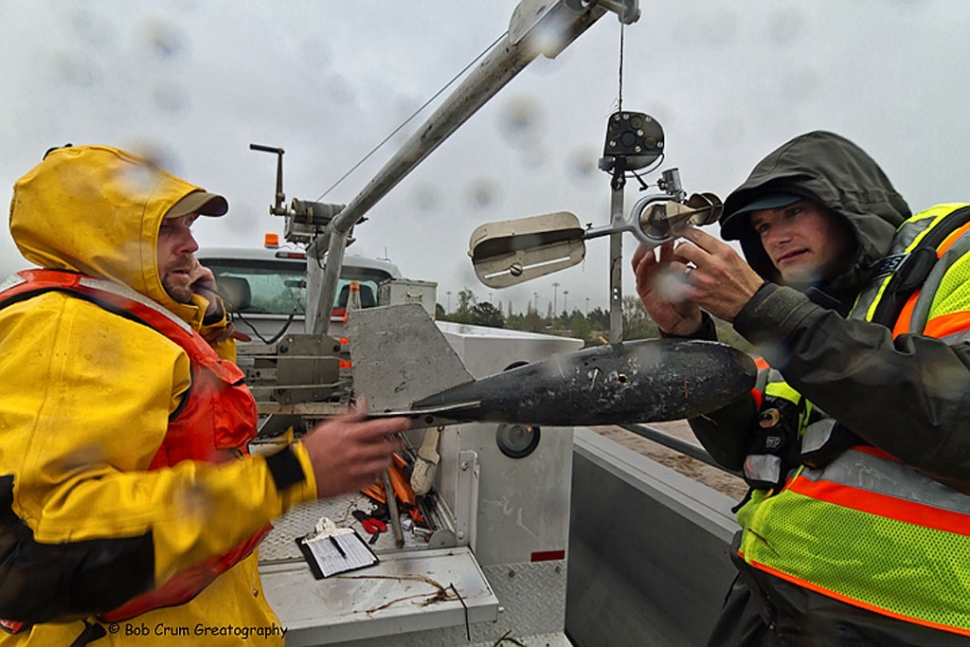 (l-r) Matt Melchiorsen and Mike Gaedeke readjusting the Price AA stream flow measuring device above the lead weight. Seeing spots? Relax. Your eyes are OK. The spots are water drops on the lens. It was raining! 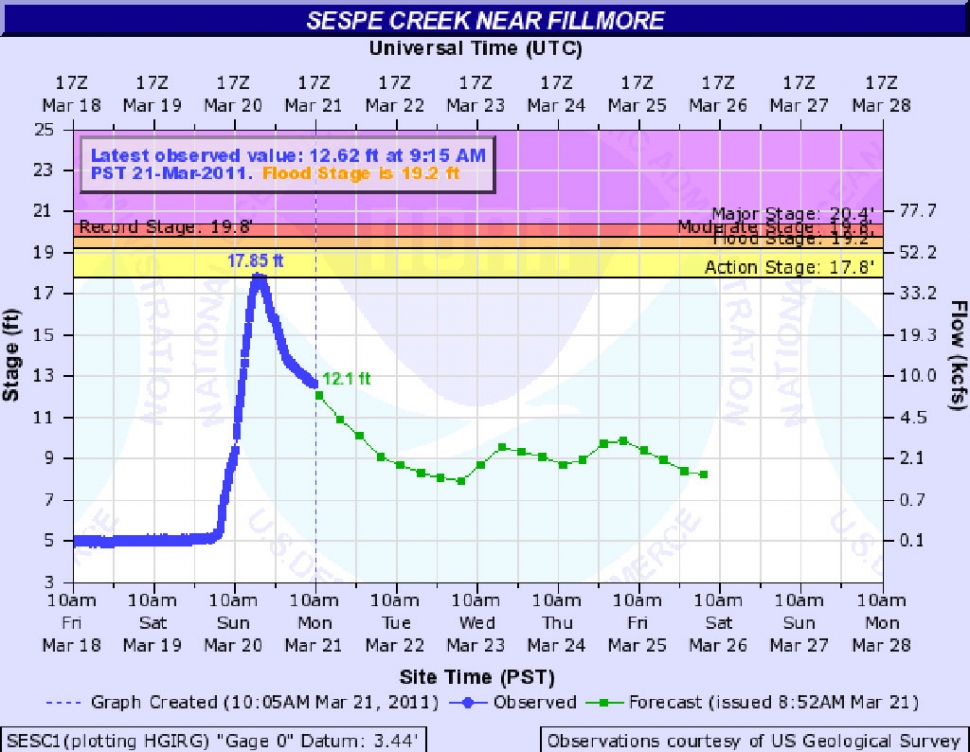 Graph of stream height measured at monitoring station upstream from Old Telegraph Road. Mother Nature roared... poured... and Sespe Creek did rise. And it's flowing a shade of muddy chocolate. Being the biggest rain “event” since 2005, the United States Geological Survey (USGS) dispatched a crew from Santa Maria to measure... and document... the creek stream flow. Scientifically speaking... discharge is the volume of water moving down a stream per unit of time, commonly expressed in cubic feet per second or gallons per day. In general, creek discharge is computed by multiplying the area of water in a channel cross section by the average velocity of the water in that cross section. The method used by the USGS team on Sunday 3/20/11 was the current-meter method. They first tied a string marked in one-foot increments across the Old Telegraph Road bridge. Every eight feet or so... they lowered a Price AA measuring current meter suspended above a heavy lead weight. The Price AA current meter has a wheel of six metal cups that revolve around a vertical axis. An electronic signal is transmitted by the meter on each revolution allowing the revolutions to be counted and timed. Because the rate at which the cups revolve is directly related to the velocity of the water, the times revolutions are used to determine the water velocity. The reading was taken at about every eight feed across the entire width of Sespe Creek. According to Matthew Scrudato of the Santa Maria USGS field office, measurements are taken during major weather events in order to maintain data relative to stream capacity compared to base level flows, stream flow shifts, creek bed shifts and other related data. Scrudato emphasized that the USGS is a data collecting agency – not a managerial agency. The data they collect is used by a several agencies involved in flood stages and control, stream bed shifts and the like. In case you're wondering, the stream flow under the Old Telegraph Road bridge at 5 PM, 3/20/11, measured 35,700 cubic feet per second. That is a lot of water. But not as much as the creek flow of 2005. Use this url to monitor the USGS creek flow monitoring station #11113000 in Fillmore.. http://waterdata.usgs.gov/ca/nwis/current/?type=flow&group_key=NONE&sear... |